Code Generation Bot
🤖💻 Code Generation Bot
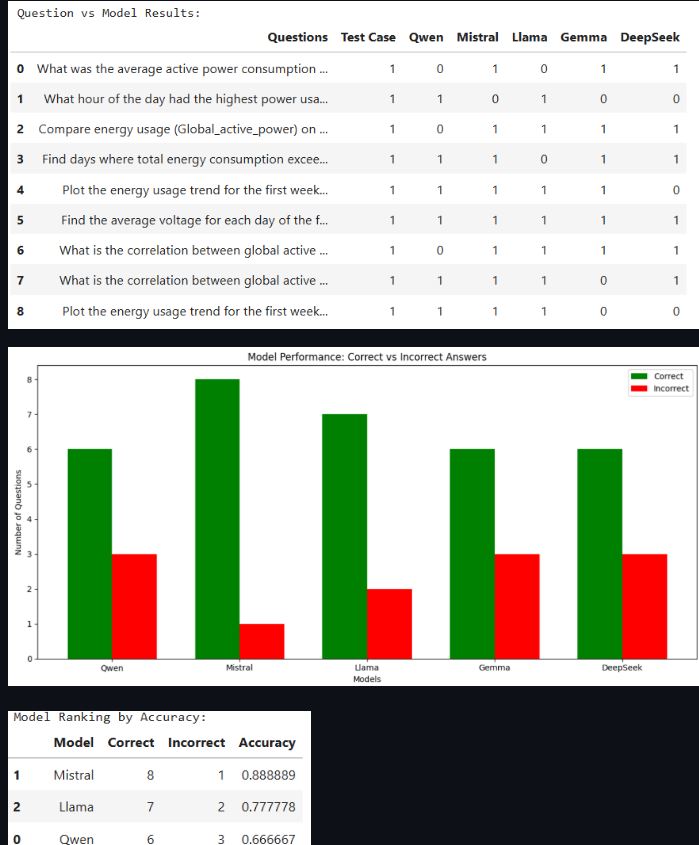
This project evaluates the performance of five open-source Large Language Models (LLMs) in generating Python pandas code from natural language queries. The models are tested on energy data use cases such as computing daily trends, correlations, and plotting patterns for energy disaggregation.
🚀 LLM's Used
- Provider: Groq
- Models: llama-3.3-70b-Versatile, gemma2-9b-it, qwen/qwen3-32b, deepseek-r1-distill-llama-70b, mistral-saba-24b
- API Key: Required for access to Groq models
🗃️ Dataset
- Source: UCI Machine Learning Repository
- File: household_power_consumption.txt
- Path: https://archive.ics.uci.edu/ml/datasets/individual+household+electric+power+consumption
🏗️ Summary
- Loaded and preprocessed the Household Power Consumption Dataset
- Sent natural language queries to a Groq-powered LLM
- Parsed the returned Python pandas code and executed it dynamically
- Printed results or visualizations based on user queries
- Examples of tasks handled:
- Average power usage over specific dates
- High-usage day detection
- Hourly or daily trend visualizations
- Correlation checks among variables
📄 Files included
| File | Description |
|---|---|
| llama_3_3_70b_Versatile.ipynb | Responses and analysis using LLaMA |
| gemma2_9b_it.ipynb | Code outputs using Gemma |
| qwen_qwen3_32b.ipynb/td> | Responses from Qwen |
| deepseek_r1_distill_llama_70b.ipynb | Code and results from DeepSeek |
| mistral_saba_24b.ipynb | Output logs from Mistral |
| TestingQueries.ipynb | Common testing queries for all models |
| llm_results.ipynb | Combined analysis, accuracy comparison, and visual plots |
🔍 Queries Evaluated
Each model was prompted to answer:
- What was the average active power consumption in March 2007?
- What hour of the day had the highest power usage on Christmas 2006?
- Compare energy usage (Global_active_power) on weekdays vs weekends.
- Find days where total energy consumption exceeded 5 kWh.
- Plot the energy usage trend for the first week of January 2007. Can you aggregrate data by month.
- Find the average voltage for each day of the first week of February 2007.
- What is the correlation between global active power and sub-metering values?
- What is the correlation between global active power and sub-metering values?. Can you show it using visualization.
- Plot the energy usage trend for the first week of January 2007. Can you aggregate data by day.
✅ Evaluation Criteria
Each model was scored on:
- Code generation (was valid Python returned?)
- Execution (did the code run without error?)
📈 Results
- For result and discussion refer this repo: GitHub
📜 License
This project is part of my side projects. Feel free to use and adapt it for educational or non-commercial purposes.